Foreword: My personal problem with AI value
To those who are lost in the AI ambiguity,
A new AI report is published every week. You see another piece of content that says AI creates incredible value. The problem is that every report measures value differently: hours saved, tickets resolved, code shipped, documentation time reduced, revenue generated, errors avoided, or hopefully global GDP lifted.
We were promised a revolution, while I saw a consistent pattern of 20–40% uplifts in various areas. Considering a staggering $1 trillion in capital expenditures from tech giants in 2026, this seemed... low.
None of these sector studies is comparable until you put them on a common economic denominator, so I tried to do that. I was literally lost in the constant stream of numbers and the unclear potential value of AI.
As a scientist myself, I ran a meta-analysis of 67 sources 1,2,12… — macro journals, consulting reports, RCTs, and the publications shaping public opinion (McKinsey, Bain, BCG, Goldman Sachs, MIT, Stanford, Harvard, and others in the reference list). I did not find another synthesis that puts fragmented AI productivity claims on one comparable percentage scale; that gap is what the AI Value Index (AVI) is for. Definition, formula, and design history are in Part II (including an expandable AVI design & methodology panel); how the desk research was done is in Methodology: how this report was built.
It's funny, because I have used a lot of AI to deliver this (Claude, Perplexity, Cursor, Statista AI Assistant).
Honestly, I believe we are going in a certain "chimera"-like language and outputs. One can say it creates a certain "monstrosity" language where real AI value meets the AI slop, and where human synthesis capabilities meet human laziness.
My relation with AI was following: I was the craftmaster, an AI was the apprentice. Very fast, capable, but only a practitioner. I believe the overall narrative, methodology is well defined, because it's mine.
Where this report lacks, for sure, is simply because of my AI capabilities — again meeting Liebig's law (see next paragraph) where my knowledge is simply the scarcity.
I normalized those sources into AVI; the pattern is consistent but bounded. I was right: while some headline claims cluster around a 20–40% uplift on the task being measured, it was just a high anchor for the memory.
The median realized business impact across sectors is closer to 15 percent. Meaningful, yet definitely not transformational. AI in current systems is a highly effective tool; however, it is not a 10× output revolution we are promised.
The AI moguls say, "This time is different."
Dario Amodei 47 says half of entry-level white-collar jobs disappear within five years. Sam Altman says AGI is here, intelligence is too cheap to meter. Jensen Huang 52 from Nvidia says every job will be affected immediately. The Anthropic Economic Index report 49 says 49 percent of jobs see AI used for a quarter of their tasks. Each statement is in the public record, sourced and quoted below. What enterprises measure on P&L lines, and what happens when firms try to swap headcount for models at scale, tells a different story.
Marc Benioff from Salesforce recently acknowledged 37 that cutting thousands of roles to "replace them with AI" had been a mistake. The overall quality fell, and rehiring followed. Well, he stated publicly what the P&L already implied. When Salesforce cut its customer support from 9,000 to 5,000 in 2025, the company spent the next three months walking it back.
Klarna replaced 700 customer service agents with OpenAI and is now rehiring. IBM automated 94 percent of routine HR tasks with AskHR, and the total IBM headcount rose, not decreased. The pattern is repeating elsewhere: efficiency-first layoffs followed by quality regression and partial rehiring.
These cases are public; far from anomalies, they are what happens when headline AI efficiency meets enterprise reality — quality regression, partial rehiring, and P&L lines that tell a quieter story than the press release.
Valueships - pricing engineers for tech companies
Valueships is a consulting boutique specializing in crafting pricing & commercial solutions for tech companies. We want you to pursue your strategic vision without compromise, and increased EBITDA is a way to achieve it!
Our team is about 30 ex-MBB consultants, scientists with Ph.D.s in pricing and management science, and data engineers who make sure your pricing strategy does not stop in PowerPoint — it goes to market and wins.
We run proprietary models, frameworks, agents, and tools under ValueOS, built from 200+ pricing projects.
For this report, the AI Value Index (AVI) and AVI Pricing Quadrant™ are the next step: pricing logic for the AI era.
Use the frameworks to stress-test your strategy and pick an operating model that fits your sector.
Enjoy!
The binding constraint: human capabilities
Method (Liebig / constraints): Interpretive framework linking RCT task gains to firm-level bottlenecks. Not a measured coefficient in this report. The interactive bar chart is illustrative; METR (below) is the empirical counterpoint to "generation speed = productivity."
Have you heard of Liebig's law of the minimum (often misattributed, but the name stuck)? Growth is capped by the scarcest input, not by the inputs you have in surplus. It was quite popular in the Dune books; here is the agrarian version. In a field short on potassium, you harvest only what the limiting nutrient allows. In a strategy game with wood and stone to spare but no gold, your settlement stops growing for lack of gold, not lack of lumber.
Applied to AI adoption today, compute and model capability are not the limiting factor for most firms. Human capability and attention of using AI is.
Models draft, summarise, code, and route work quickly. Someone still has to verify output, edit tone, reconcile errors, own accountability, and decide what ships. Silicon Valley engineers running agents at scale report the same operational joke: you still cannot walk away from the laptop or close the lid as agents need supervision, code review, and judgment. You are a resource in scarcity. You simple can't click "allow" that many times. That is not a settings problem alone; it is a throughput limit on review and trust. AI accelerates the first mile of work. It does not remove the human from the last mile at enterprise reliability standards.
Similar to this is Goldratt's Theory of Constraints and Liebig's minimum ask the same managerial question from different angles: do you pour more of the scarce resource into the bottleneck, or redesign the system so the bottleneck stops binding? Bolting agents onto existing workflows increases demand for the same scarce resource, which is a skilled attention, unless you change roles, handoffs, and what "done" means.
That is why local task gains of 20 to 40 percent so often fail to show up as firm-level productivity. You simply meet the resource in scarcity or face a huge bottleneck that is not easy to overcome. In other words, we operate to fulfil the system capacity to handle.
A useful diagnostic for any AI program: are we training people to fit the tool (prompting, RAG stacks, agent orchestration inside legacy processes), or rebuilding the production system around what the tool actually does well? The historical evidence below says only the second path produces step-change gains.
The historical productivity ladder
Putting AI's measured macro signal on the same scale as every previous productivity revolution forces the order-of-magnitude question:
Tap any wave to expand — methodology, period definition, and sources.
Agrarian revolution
post-1600
0.30 %/yr
First industrial revolution
1780–1860
0.78 %/yr
Electric / 2nd industrial
1920–1970
2.82 %/yr
ICT baseline
1970–2015
1.38 %/yr
ICT revival
1994–2004
2.26 %/yr
LLM-era AI
2024–2034 (10-year view)
0.09 %/yr
an electric-scale revolution.
Of course it is hard to compare the agrarian revolution to AI when the speed of information was completely different — horse-carriage times versus fiber bandwidth. That is why I normalized every productivity gain against information speed.
Electricity looks like a certain sweet spot: the technology lifted productivity and accelerated information speed itself (radio, telephony, broadcast). A snowball effect.
On that lens, AI embedded in today's systems is potentially not groundbreaking — yet. It may change when we build new systems around it: agentic platforms that communicate on their own and route work without sitting behind the human review bottleneck.
Hover points for era labels · dashed line = expected trend excluding LLM-era AI · Sources: Crafts 3, Gordon 4, Acemoglu 1.
Acemoglu's MIT benchmark for LLM-era AI 1 is 30× below the electrification peak, 25× below the ICT revival, and 8× below the first industrial revolution.
Every prior general-purpose technology had a diffusion lag:
- Electricity: ~30–40 years from the dynamo (1880s) to the productivity surge (1920s).
- IT: ~20 years before the paradox broke. In 1987 Robert Solow 53 wrote in the New York Times Book Review that "you can see the computer age everywhere except in the productivity statistics" — true until the late-1990s lift.
LLM-era AI in 2026 is in early diffusion, not at a productivity peak.
Information velocity compresses the calendar, not the economics. Eighteenth-century news moved at horse speed; today it moves at feed speed. Two years of generative AI have generated more headlines than decades of industrial diffusion — yet measured productivity per calendar year is, if anything, weaker than prior waves relative to capital already committed. Speed of awareness is not speed of restructuring.
Who wanted to win built a new system around the technology. Who bolted technology onto the old system stayed in the low-teens percent band.
System redesign, not gadget insertion, separated step-change from incremental gain in every prior wave:
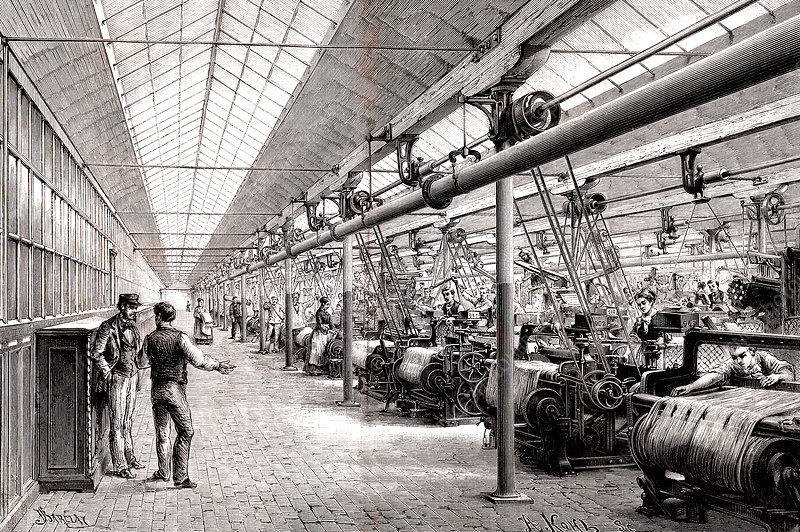
- First industrial: New factories around machines — not steam engines wedged into old workshops.
- Electrification: Ford's River Rouge (through 1928) — greenfield for power and moving assembly, not bulbs in a barn.
- ICT: Mainframes in the 1970s changed little until PC, email, networked processes, and decentralized management rewired work.
- Spreadsheets (1980s): Excel did not speed old control systems — it enabled new ones ("power CFOs", consolidated reporting, valuation workflows).
- Retail ops: Walmart's early POS, barcodes, and logistics — value followed process redesign around the tool, not drop-in automation.
- Firms (1990s): Brynjolfsson 2 — IT payoffs where skills, management, and workflows moved together. His productivity J-curve 2: complements delay macro gains for years even when micro experiments look strong.
"The first rule of any technology used in a business is that automation applied to an efficient operation will magnify the efficiency. The second is that automation applied to an inefficient operation will magnify the inefficiency." — Bill Gates
LLM-era AI applied locally to today's processes — without role redesign, without new accountability for machine output, without factory-floor logic — lands in the low-teens percent band the AVI measures. That is consistent with history. It is uncomfortable relative to $725 billion of hyperscaler CapEx projected for 2026 alone 71.
Right now we have what I would call "bounded value": as long as we keep bolting AI onto old systems, we will not unlock what the technology can do. The ceiling is organisational, not algorithmic.
Want to change the world? Reinvent the shop floor.
Macro estimates — what the serious models actually say
Method (macro): Independent macro and meso estimates only (NBER, OECD, IMF, census surveys, peer-reviewed micro-to-macro bridges). No vendor-only ROI decks. Figures match the published sources; the cards state scope where horizons differ (10 yr vs 2040). Key citations: 1,8,11…. Full list in References (APA).
Vendor decks rarely agree on one number. Independent macro work does agree on something narrower: modest near-term TFP and GDP gains, with upside tied to adoption depth and complement investment — not to today's pilot evidence alone.
US GDP to ~2034
~0.4 pp cumulative GDP · up to ~1.5 pp/yr productivity in broad-adoption scenario
Bullish long run, delayed ignition — little measurable GDP impact before ~2027
10 years, task-based
<0.55% TFP · GDP effects <0.9% in moderate exposure
Hard to defend large macro gains from current task exposure alone
10 years
0.25–0.6 pp/yr TFP · 0.4–0.9 pp/yr labour productivity
Middle of the range — meaningful, not miraculous
McKinsey Global Institute (2023)
To 2040
$2.6–4.4T/yr value pool · genAI labour productivity 0.1–0.6%/yr
Large addressable value, thin annual productivity flow
Brynjolfsson, Li & Raymond (NBER / QJE)
Micro, customer support
14–15% uplift · concentrated in lower-skilled workers
Strong task evidence, slow organisational payback (J-curve)
None of these bodies are trying to minimise AI. They are measuring realized economic throughput after exposure, adoption, and complementarity — the same object the AVI approximates at sector level. The CapEx line and the productivity line are on different slopes today.
The CapEx vs productivity math
Method (CapEx chart): Hyperscaler CapEx ($B/yr) from Statista / Goldman synthesis (2022–2027E). LLM-era productivity (%/yr) from Acemoglu NBER w32487. Different units on dual axes, shown together for contrast, not as a fitted regression. Bain $2T revenue gap and Covello/Hatzius quotes are cited in the text.
Big Tech hyperscaler annual CapEx has gone vertical while measured LLM-era productivity remains stuck near the 0.09 %/yr Acemoglu benchmark 1 — two different slopes on the same timeline.
Bain's 2025 Technology Report 35 calculates that the sector needs $2 trillion of new annual revenue by 2030 to fund the announced compute buildout. Combined AI application revenue today is under $50 billion. That is a 40× revenue gap that has to close through some combination of buyer adoption, pricing expansion, or financial reset.
Goldman Sachs' James Covello — author of Gen AI: Too Much Spend, Too Little Benefit? 9 (June 2024) — said in 2026 that he had been wrong about details but "more convinced" on the central question: AI augments at the margins; the spending is not producing commensurate returns. Hatzius, Goldman's chief economist, has stated publicly that AI's contribution to US GDP in 2025 is "basically zero." Goldman's own data has the ratio that does not math. See Goldman Sachs, Gen AI: Too Much Spend, Too Little Benefit? (2024); Tracking trillions (2026).
Don't ask the barber if you need a haircut — some quotes from AI moguls
Method (CEO quotes): Verbatim public claims from hyperscaler and frontier-lab leaders (2024–2026), chosen to show the maximalist narrative. Enterprise cases and macro estimates counter them later. Not a representative sample of CEO speech.
Overselling is part of every CEO's job, and many are very good at it. That is not a moral failure; it is what markets reward. But when a handful of leaders run companies that together make up a large share of the S&P 500, their narratives shape global trade, capital allocation, and even geopolitical risk. We should read those narratives carefully. That is one reason reports like this exist: to stack public claims against measured evidence.
Dario Amodei (Anthropic CEO), May 2025 (Axios / Fortune): "AI could wipe out half of all entry-level white-collar jobs and spike unemployment to 20 % within one to five years." 47
Dario Amodei, Machines of Loving Grace (October 2024): "Powerful AI — smarter than a Nobel Prize winner across most relevant fields — could come as early as 2026." 46
Sam Altman, Reflections (January 2025): "We are now confident we know how to build AGI as we have traditionally understood it."
Sam Altman, Fortune (July 2025): "Intelligence too cheap to meter is well within grasp."
Jensen Huang, Milken Institute (May 2025): "Every job will be affected, and immediately. You're not going to lose your job to AI, but you're going to lose your job to someone who uses AI." 52
Jensen Huang, TechCrunch (March 2024): "If AGI is defined as a software program performing 8 percent better than most people on a specific set of tests, AGI is within five years." 51
Anthropic Economic Index (March 2026): "49 percent of jobs see Claude used for at least a quarter of their tasks." 49
Sector perspective: digging into fragmented evidence
Method (micro → sector): Task-level evidence (RCTs and field experiments first, surveys second) mapped to **17 sector synthesis lines**. Each AVI row combines **Revenue Impact %**, **Cost Impact %**, and **Revenue/Cost Share of value** (judgment where studies use different units). Formula and calibration: Part II and AVI design & methodology.
The micro evidence is everywhere, and every study measures something different — obviously vertical-oriented metrics. Every consulting firm, think tank, or academic paper has a different number. The fragmentation is simply too high to form a reliable view. That's why I created the AI Value Index (AVI), described in a later part of this report.
Reports remember the high bound (20 to 40 percent on a named process). Boards rarely see the firm-level realized impact after review, rework, governance, and uneven rollout. That gap is not measurement error alone; it is Liebig's minimum operating in the wild: the scarcest step is no longer "produce the draft" but "stand behind the output."
What the best articles in the field tell us about AI value
Method (RCT band): Peer-reviewed or NBER/HBS field experiments with controlled designs. They set the 14–40 % task-level band used as an input floor for AVI, not firm-level P&L. Citations: 19,20,23… in References (APA).
The most rigorous workplace AI studies are randomised controlled trials. They produce a tight range, but it's nowhere close to the overpromised 10× increase. It's a lot, yet it's definitely not that high.
- Noy & Zhang, 2023 (Science) 29: 453 professionals on writing tasks. 37 % time saved, 18 % quality improvement. Lower-skilled workers gained most.
- Brynjolfsson, Li & Raymond, 2023 / 2025 (QJE) 19,20: 5,179 customer-support agents at a Fortune 500. 14–15 % average productivity uplift. 34 % for novices; near-zero for top quintile.
- Dell'Acqua et al., 2023 (HBS-BCG) 23: 758 BCG consultants. 25 % faster, 12 % more tasks, 40 % higher quality inside AI's capabilities. 19 percentage points worse outside them.
- GitHub Copilot RCT, 2023 26: 95 developers, controlled task. 55 % faster on a green-field HTTP-server task.
- METR, 2025 27: 16 experienced open-source developers, 246 real-world tickets. 19 % slower with AI than without — despite developers reporting they felt 20 % faster.
- Choi & Schwarcz, 2024 22: Law students, GPT-4. Large speed gain, uneven quality lift.
- JAMA Open / TPMG, 2024–2025: AI medical scribes 39,45. 16 minutes saved per 8-hour shift; physician burnout down 13 percentage points in 30 days.
The convergent band is 14 to 40 percent task-level uplift on AI-fit work, with negative effects when AI is applied to mis-fit tasks. This is the empirical floor of any defensible AI productivity claim.
METR is the cautionary Liebig case: experienced developers were 19 percent slower with AI on real tickets while believing they were 20 percent faster. Perceived speed on generation; measured speed after review, debugging, and trust. Any ROI model that counts only the first mile systematically overstates value.
Sector by sector: 12 industries, mapped
Task-level studies vary by industry, and we can't easily tell what the real value is. Whether it's revenue increase or cost decrease, the signal is highly dispersed. My take was to create the AI Value Index (AVI) — which I describe in Part II of this report — as one clear economic metric you can use to compare overall value added across sectors. The chart below shows where that lands:
Hover bars for AVI %. Median across 17 sector lines: ~15 %. Only four sectors clear 25 % — the threshold that typically defends outcome-based pricing.
An exemplary study: MIT NANDA: 95 percent of pilots produce no P&L
MIT's NANDA initiative published State of AI in Business 2025 37 in August 2025 (150 leader interviews, 350 employee surveys, 300 public deployments):
- 95 % of enterprise GenAI pilots show no measurable P&L impact, on $30–40B of enterprise GenAI spend.
- 5 % of pilots show rapid revenue acceleration.
- RAND (2024) 38: >80 % pilot failure — about 2× non-AI IT projects.
McKinsey State of AI 2025 13:
- Only 39 % attribute any EBIT impact to AI; most of those say <5 % of EBIT.
- Function-level wins are real (10–20 % cost savings in software, manufacturing, IT).
- Enterprise roll-up still loses to integration, governance, security, and aggregation friction.
The case studies: the layoff-then-reverse pattern
Method (enterprise cases): Public filings, earnings calls, and CEO statements (2023–2025). Not independent ROI audits. Selected for layoff → quality regression → partial rehire. Paired with MIT NANDA 37 and McKinsey 13 above. See also 38.
Four enterprise cases now form the public record on AI-driven headcount strategies:
- Salesforce: customer support headcount cut from 9,000 to 5,000 in 2025; CEO publicly said "I need less heads"; AI handled 50 % of conversations; support cost down 17 %. By December 2025, the company was publicly walking it back — institutional knowledge loss, complex-case quality regression, rehiring.
- Klarna: 700 customer service agents replaced with OpenAI (2022–2024); claimed 75 % of chat volume automated. By 2025: CSAT dropped, complaints rose. CEO Siemiatkowski: "we focused too much on efficiency." Rehiring underway.
- IBM: Krishna's AskHR agent automated 94 percent of routine HR tasks, displacing ~200 HR roles. Total IBM headcount went up, not down — redeployed into engineering, sales, "critical thinking." Public framing evolved from "30 percent replaceable" (2023) to "redeployment, not reduction" (2025).
- Duolingo: April 2025 "AI-first" memo triggered immediate backlash — 1,000+ LinkedIn comments, 600 reposts. Within four months, von Ahn clarified that no full-time employees would be laid off. Soft-version Salesforce.
I observe the following pattern. There are some cost-savings gains, yet they are far smaller than promised, and they are usually eaten up by lower quality and increased bottlenecks in the organization. The key reason? They are operating in the old system.
The Value Equation and creation of AI Value Index - one metric to rule them all
Method (frameworks): Value Equation and AVI follow standard B2B value decomposition (Anderson, Narus & Van Rossum 54; Hinterhuber 56). Valueships work: calibrating inputs from this meta-analysis, sector normalisation, pricing-band thresholds, and vendor-capture bands. Formula lineage and open vs proprietary detail: AVI design & methodology.
The Value Equation - pricing science applied in practice
I believe in transparency and in building in public. This report is about increased value — and we chose to develop the frameworks with AI, not only about it. My working relationship with the models was closer to professor and student than to autopilot: I set the brief, the tools produced drafts and iterations, and the reviewing, rejection, and final direction stayed with the author. I think that is a good and ethical way to use AI for research synthesis: accelerate the loop, keep accountability human. For the full iteration log — kernel, asymmetric VII draft, symmetric AVI, and what is open vs Valueships-specific — see AVI design & methodology.
Across every sector, every AI use case, every productivity claim, value reduces to two components:
Value created by AI = Revenue Increase + Cost Savings
The AI Value Index (AVI)
In one sentence: AVI is the standard B2B value decomposition (Anderson, Narus & Van Rossum 54; Hinterhuber 56) applied to AI productivity evidence, with revenue and cost each weighted by its share of realised value — two auditable inputs, one percentage output. What is Valueships-specific is the calibration for AI (Revenue/Cost shares from this meta-analysis), the pricing bands tied to AVI, and the vendor capture sub-index below.
Sector benchmarks — from AVI % to dollars per employee
AVI gives you a percentage you can compare across sectors. Buyers and boards still ask: what does that mean in money? This table answers that by translating each sector's AVI into annual dollars per full-time equivalent (FTE) — one knowledge worker (or equivalent role) in that industry, on sector-typical loaded labour economics.
How to read the columns
| Column | What it means |
|---|---|
| Rev Impact / Cost Impact | The raw productivity evidence inputs (before weighting) — uplift on revenue and savings on labour or COGS. |
| Rev Share | How much of total AI value in that sector sits on the revenue side vs cost (must sum with cost share to 100 %). |
| AVI | The blended index: both sides weighted by share — the number you use to compare sectors and set pricing ambition. |
| Value $/FTE/yr | Economic value created if AVI were fully realised on one FTE: AVI × sector-typical loaded cost per employee per year. Example: 28.6 % AVI on ~$80K loaded back-office labour ≈ $23K of value per seat per year — not necessarily cash in year one, but the size of the prize if adoption and restructuring catch up. |
| Vendor $/FTE/yr | Illustrative vendor revenue at the capture rate typical for that row's pricing band (see Vendor capture below). High-AVI, high-attribution sectors support outcome pricing (~30–50 % capture); subscription bands sit nearer 5–10 %. |
| Pricing band | Which pricing model the AVI + attribution profile supports (the section below maps these to the AVI Pricing Quadrant™). |
Rows are synthesis lines, not a single company's pilot. Use them to benchmark a sector narrative, stress-test a business case, or see why finance back-office and legal doc review look like outcome zones while education and government look like subscription plays.
Method (benchmark table): Value $/FTE/yr = AVI × sector-typical fully loaded labour cost (higher in legal doc review than education, for example). Vendor $/FTE/yr = illustrative capture at the zone's typical rate, not a market price survey. Inputs: sector studies, Statista 59,64,65, RCTs 19,29. Rev/Cost shares use judgment where evidence conflicts.
Median AVI across 17 sector lines: ~15 percent. Only four sector lines clear 25 percent (the threshold that defends outcome-based pricing).
Vendor capture — what you can charge vs what the customer keeps
Method (capture): Capture rates (2–50 % of value pool) from Statista 65,55 and public list prices (Copilot, Intercom Fin, etc.). Illustrative bands, not a transaction database. Worked example: 300 FTE × $90K loaded.
The sector table's Value $/FTE/yr is what AI creates for the customer. Vendor $/FTE/yr is what you can realistically charge — and the two are not the same. Buyers will not hand over 100 % of measured productivity gain; procurement, competition, and attribution risk cap what sticks as vendor revenue.
Vendor capture is the share of customer value that becomes your price. In practice most AI vendors today capture only 2–8 % of the customer's underlying labour cost — even when AVI looks generous. That is why a $30/seat/month Copilot line can still imply a 40×+ ROI for the buyer: the value pool is large; the vendor's take is small.
Why the value-equation answer matters for pricing
Pricing implications by sector
Method (pricing): Pricing zones combine AVI (Part II) with an attribution score (0–100): expert judgment on whether procurement can audit one outcome unit per sector. Not a statistical estimate. Outcome ★ thresholds: AVI ≥ ~15 % and attribution ≥ ~70 (see axis table). Buyer preference: Statista 2025 66.
The AVI Pricing Quadrant™
Part II answered how much value AI creates by sector (AVI % and dollars per FTE). This section answers the next question: which pricing model can you defend? Not "add 20 % because it is AI," but outcome, effort/credits, premium seat-plus-bonus, or subscription.
The AVI Pricing Quadrant™ plots each sector on two scores:
- AVI (horizontal): size of the economic prize if value is realised. Below ~15 %, AI still reads as a productivity tool in the benchmark; at 15 %+, the value pool supports bolder packaging.
- Revenue attribution (vertical): whether procurement accepts a single attributable unit tied to your product (resolved ticket, closed deal, reviewed document, fraud case avoided). High AVI with low attribution is common: large value, weak proof.
Chart position maps to one of four pricing zones, each with a typical capture band (share of value that becomes vendor revenue; see Vendor capture above). The chart below shows 17 sectors as bubbles: position = AVI × attribution; bubble size = value $/FTE/yr from the sector table.
Headline results
- Outcome ★ (high AVI, high attribution): five sector lines: finance back-office, marketing creative, manufacturing lighthouses, legal document review, and sales when conversion ties to a clean unit. Rare cases where outcome or gainsharing at 30–50 % capture holds up economically.
- Effort (high AVI, low attribution): five sectors: software development, consulting, TMT IT, financial services overall, healthcare clinical (scribes). Large value pools (healthcare ~$39K value/FTE/yr), but no single auditable outcome, so vendors use credits, consumption, or complexity tiers (10–25 % capture).
- Premium (moderate AVI, cleaner attribution): three sectors: customer service, consumer & retail, legal senior advisory. Seat-plus-bonus or hybrid (10–20 % capture): attribution is good enough for a bonus tier; AVI stays below the outcome band.
- Subscription (lower AVI, weak attribution): four sectors: AEC/construction, average manufacturing plant, government, education. Per-seat with usage caps (5–10 % capture). Measured AVI and provable attribution in the public evidence both stay modest.
Median AVI ≈ 15 %: horizontal split between subscription/premium and effort/outcome. Only four sectors clear 25 % AVI; outcome pricing still needs attribution (legal advisory: decent AVI, attribution too fuzzy for pure outcome).
| Axis | Low | High |
|---|---|---|
| AVI (horizontal) | <15 %: productivity tool band | ≥15 %: material value band |
| Revenue attribution (vertical) | Hard to tie one outcome unit to the product | Clean trace from product → revenue or cost line |
Buyer-side pricing preference
Method (buyer survey): Statista (2025) 66: share of enterprises that prefer each pricing model for agentic AI tools. Multi-select allowed; percentages are not mutually exclusive. Stated preference, not contract terms. Compared to the Quadrant's sector-by-sector model choice.
The quadrant picks the economically defensible model. Buyer preference picks what closes. Statista's 2025 survey 66 on preferred pricing models for agentic AI shows a systematic gap between vendor narrative and procurement reality:
The 3× mismatch: buyer preference vs vendor pitch
Enterprises preferring consumption / usage
55%
#1 buyer choice (Statista 2025)
Enterprises preferring outcome-based
17%
Buyers want predictability; attribution is hard
5 of 17 sectors in Outcome ★ on the AVI quadrant: outcome / gainsharing fits the economics (~29 % of benchmark rows)
17% of buyers prefer outcome pricing. Vendor decks often lead with the opposite story.
Pricing-page rule: Lead with consumption or hybrid (what most buyers want). Reserve outcome / gainsharing for Outcome ★ sectors and attribution-mature accounts, not as the default headline.
The 10× pricing test
A vendor can defensibly charge 10× their non-AI predecessor only if one of five conditions holds:
- Scarce specialist labour replacement — senior radiologist, M&A partner, ML scientist — when AI quality reaches that level on the specific task.
- Revenue-generating outcome with clean attribution — conversion lift, fraud recovery — where procurement accepts the attribution.
- Bottleneck / capacity unlock — drug discovery cycle, M&A diligence — where time-to-market value dwarfs the price.
- Regulated workflow with liability — AML/KYC, SOX, medical documentation — insurer-style premium where AI assumes risk.
- Mission-critical reliability with HITL — narrow domains where the alternative is unacceptable.
Outside these five conditions, the 14–40 percent RCT evidence does not support 10× pricing. For the 95 percent of knowledge work that sits outside them, defensible pricing follows the AVI band.
Labour productivity implications
This report's macro evidence supports a specific labour story:
- Aggregate labour displacement is much smaller than maximalist claims, and reversing in public where it happened (Salesforce, Klarna).
- Skill compression is real: the most rigorous RCTs (Brynjolfsson, Noy/Zhang, Dell'Acqua) all find AI lifts low-skill workers most and provides little or negative uplift to high-skill workers. The wage implication: AI is a wage-compressor in the short run.
- Total headcount tends to stay flat or rise when AI is applied to back-office routine (IBM AskHR is the cleanest case). The Salesforce strategy of cutting headcount in proportion to AI deployment is empirically failing.
- Hourly billing models compress slowly: Statista 63 shows only 44 percent of respondents expect hourly billing to shrink in the next five years. AI changes pricing model mix gradually, not abruptly.
The right narrative for the labour question: AI moves productive workers faster on the AI-fit slice of their work; it does not yet replace the workforce at scale; and the firms that bet on full replacement are publicly walking it back.
Why scale may still fail: political and social friction
Method (political friction): Historical comparison plus Duolingo, Salesforce, and Klarna cases. Interpretive thesis on adoption ceilings; not modelled in AVI or the Quadrant.
Technology curves and AVI math are not enough for civilisation-scale adoption. Displacement has a balance sheet outside the firm.
| Era | What happened |
|---|---|
| 19th century | Clearing workshops: low political cost, thin social insurance. |
| 21st century | Hyperscaler / SaaS at scale: halving headcount on an AI story triggers brand risk, regulators, unions, customers, and fiscal cost of displaced taxpayers. |
Public cases:
- Duolingo (2025): "AI-first" memo → backlash → clarification that no full-time roles would go (soft version).
- Salesforce, Klarna: Cuts → service quality hit → rehiring (hard version).
That friction does not mean AI fails. It means the feasible path is augmentation, redeployment, and system redesign — not headline layoffs as the main value-capture move. GTM that sells "replace your team" fights the constraint; GTM that sells "more capacity per FTE" aligns with it.
This report stops at the economic and commercial boundary. Labour institutions, tax, and democratic response need a separate note. Forward thesis: even if models improve, realized value can stay capped until political and social systems absorb displacement as cheaply as nineteenth-century factories did — and they do not today.
Conclusion
What the evidence actually says
After normalising 67 sources 1,12,19… onto one scale, one picture holds — and it is uncomfortable for the maximalist story.
Macro
LLM-era AI sits near 0.09 %/yr productivity in credible models 1, against $725 billion+ of hyperscaler CapEx 71 in 2026. Prior GPT waves looked weak early too — none had this much capital committed this soon relative to measured throughput.
Task level
Rigorous RCTs cluster around 14–40 % uplift 19,29,23 on AI-fit work — real, repeatable, worth buying at the task boundary.
Firm & sector
Median AVI ~15 % 73 — meaningful, not revolutionary. Only four of seventeen sectors clear 25 % AVI. MIT NANDA 37, McKinsey 13, and layoff-then-reverse cases (Salesforce, Klarna, IBM): pilots rarely reach P&L when review and bottlenecks bind.
Pricing
Value created ≠ value captured. Vendors often realise 2–8 % of customer labour cost 65,55 as revenue. Buyers prefer consumption / hybrid (55 %) over outcome (17 %) 66 by ~3× — while decks still sell outcome. Quadrant 74: only five sectors in Outcome ★.
Bottom line
The point is not “AI fails.” Gross AI can look like a revolution; net AI inside unrestructured organisations behaves like a strong productivity tool — bounded by human attention, proof of attribution, and the political cost of displacement.
What to do with it
If you sell AI or AI-augmented services
- Price the sector's AVI band, not the keynote. Anchor every business case in revenue + cost decomposition (Value Equation → AVI), not in "10×" language the macro math and public case studies do not support.
- Choose the model from the Quadrant, not from LinkedIn. AVI × attribution → Outcome, Effort, Premium, or Subscription. One decision, defensible in procurement.
- Lead the pricing page with what buyers want. Consumption or hybrid first; outcome / gainsharing as a tier for attribution-mature accounts in Outcome ★ sectors, not as the default headline.
- Reframe cost-side wins as revenue capacity before procurement sees them. Eighty percent of measured value is cost-side; buyers still fund revenue stories more easily.
- Design for the Liebig minimum. Until workflows are rebuilt, not just tool-inserted, expect low-teens percent firm-level gains, not civilisation-scale jumps. Price and promise accordingly.
If you buy or govern AI spend
- Demand one comparable metric (AVI or equivalent) across vendors and pilots. Hours saved alone is not a strategy metric.
- Separate pilot uplift from P&L impact before you scale seat count or cut roles; the case studies in this report are the control group.
- Treat CEO maximalism as positioning, not as your workforce plan, until independent measurement and restructuring catch up.
- Negotiate predictability. The market prefers meters and caps; outcome contracts only where attribution is auditable.
The 10× test still applies, but narrowly: scarce expert labour replacement, clean revenue attribution, bottleneck unlock, regulated liability, or mission-critical HITL domains. Outside those five conditions, defensible pricing follows the AVI band and the capture math in this report, not the hype cycle.
Why I have created this report? tl;dr for myself
Vendors need a pricing story that survives the next board cycle. Buyers need a filter for claims that all use different numerators. Both need the same vocabulary: value created (AVI), value captured (pricing model × capture rate), and proof (attribution).
This synthesis is tied to evidence, normalised by sector, and built to survive the next press release. When the numbers move (and they will, as adoption and restructuring deepen), update the AVI inputs; the framework should not need to be reinvented.
A practitioner's check. Valueships has spent on the order of one million PLN on AI tooling, automation, and workflow experiments to date. Uplift is real in specific workflows (research synthesis, draft generation, pricing analytics) and invisible in others once integration, review time, and uneven adoption are netted out. That uneven distribution is itself evidence of Liebig's minimum: the constraint is not whether the model can draft; it is whether the organisation can absorb, verify, and commercialise output at scale.
Inside unrestructured organisations, AI remains a productivity tool, capped today by human attention, organisational design, and the social cost of displacement. Price it that way and you will still win. Price it as magic and the next earnings call will correct you.
Full methodology brief: how this report was built
Research question: What economic value does AI deliver in production today, on a common denominator, and what does that imply for B2B pricing?
Approach: Desk meta-analysis of 67 primary and secondary sources (May 2026): RCTs and field experiments, macro and sector studies, consulting surveys, Statista charts, enterprise case evidence, and documented maximalist public claims, normalised into AVI and the AVI Pricing Quadrant™. External research is the data; Valueships frameworks structure the narrative.
Method notes and superscript citations appear in each chapter. This appendix holds the map, glossary, limits, and the numbered reference list.
Where methodology lives in this report
| Topic | What we did | Where in the report |
|---|---|---|
| Source corpus | 74 numbered sources; live URL check at publication | Foreword; References (APA) |
| Historical ladder | Directional %/yr synthesis across eras | Historical productivity ladder |
| Macro estimates | Independent models only; scope per card | Macro estimates |
| Task-level band | RCT / field experiment priority | Sector perspective → RCT section |
| Sector AVI | Rev/Cost inputs + weighted AVI formula | Part II; sector benchmark table |
| Attribution & zones | Expert scores 0–100; zone thresholds | Pricing implications → Quadrant |
| Buyer preference | Statista 2025 (stated preference) | Buyer-side pricing preference |
| CEO maximalism | Selected public quotes vs measured evidence | Barber / moguls section |
| CapEx vs productivity | Dual-axis synthesis (CapEx $ vs %/yr TFP) | CapEx vs productivity math |
| Liebig / bottlenecks | Interpretive + METR counterpoint | Binding constraint; RCT section |
| Enterprise cases | Public disclosures; pattern sample | Case studies (layoff-then-reverse) |
| Vendor capture | Statista + list-price bands | Vendor capture expander |
| Political friction | Interpretive adoption ceiling | Why scale may still fail |
| Formula defence | Lineage, iterations, open vs proprietary | Part II → AVI design & methodology |
Glossary
| Term | Meaning |
|---|---|
| Value Equation | Value from AI = revenue increase + cost savings (before normalisation). |
| AVI (AI Value Index) | One percentage per sector: (Revenue impact % × Revenue share) + (Cost impact % × Cost share). Median in this synthesis ≈ 15 %. |
| Attribution | How cleanly procurement can tie one outcome unit to your product (separate from whether value exists). |
| AVI Pricing Quadrant™ | Plot AVI vs attribution → one of four pricing models (Outcome, Effort, Premium, Subscription). |
Sources and verification
Peer-reviewed papers and NBER working papers; OECD, IMF, and central-bank research; consulting macro studies (used critically); 13 Statista charts integrated where noted; enterprise case studies (Salesforce, Klarna, IBM, Duolingo); and Valueships proprietary framework documentation. Every URL in the reference list was checked live at time of publication.
Human judgment (explicit)
- Revenue / Cost Share of value per sector when studies use incompatible units or mix revenue with cost savings.
- Attribution scores (0–100) for the Pricing Quadrant: procurement-auditability judgment, not regression output.
- Selection of CEO quotes to test maximalist claims against case and macro evidence.
- Liebig minimum and political-friction sections: interpretive thesis linking evidence streams, not measured coefficients.
Limits
- Desk research only. No proprietary client field data; no new RCTs commissioned.
- Synthesis rows are sector benchmarks, not guarantees for any single deployment.
- AVI medians and zone counts will move as the source register is updated.
May 2026 — Maciej Wilczyński, Valueships.
References (APA)
All references below were verified live at time of writing. Superscript numbers in the report (e.g. 1) map to this list. Superscript numbers in the report link here.
Download full reference list (.txt)
Macro productivity, AI economics
- Acemoglu, D. (2024). The simple macroeconomics of AI (NBER Working Paper No. 32487). National Bureau of Economic Research. https://www.nber.org/papers/w32487
- Brynjolfsson, E., Rock, D., & Syverson, C. (2021). The productivity J-curve: How intangibles complement general purpose technologies. AEJ: Macroeconomics. https://www.aeaweb.org/articles?id=10.1257/mac.20180386
- Crafts, N. (2002). Productivity growth in the Industrial Revolution: A new growth accounting perspective. Federal Reserve Bank of San Francisco. https://www.frbsf.org/wp-content/uploads/crafts.pdf
- Gordon, R. J. (2016). The rise and fall of American growth: The U.S. standard of living since the Civil War. Princeton University Press. (US labour productivity — electric era and ICT baseline/revival; synthesis in FRBSF / NBER reviews.)
- Hoover Institution. (n.d.). Summary of English agrarian productivity estimates (post-1600 benchmark). Desk synthesis for the historical productivity ladder (Part I).
- David, P. A. (2001). The transition to a new economy after the Second Industrial Revolution (NBER Working Paper No. 8676). https://www.nber.org/papers/w8676
- Federal Reserve Bank of St. Louis. (2025). Generative AI and the future of work productivity. https://www.stlouisfed.org/
- Goldman Sachs. (2023). Generative AI could raise global GDP by 7 %. https://www.goldmansachs.com/insights/articles/generative-ai-could-raise-global-gdp-by-7-percent
- Goldman Sachs. (2024). Gen AI: Too much spend, too little benefit? https://www.goldmansachs.com/images/migrated/insights/pages/gs-research/gen-ai--too-much-spend,-too-little-benefit-/TOM_AI%202.0_ForRedaction.pdf
- Goldman Sachs. (2026). Tracking trillions: The assumptions shaping the scale of the AI build-out. https://www.goldmansachs.com/insights/articles/tracking-trillions-the-assumptions-shaping-scale-of-the-ai-build-out
- International Monetary Fund. (2024). AI will transform the global economy. Let's make sure it benefits humanity. https://www.imf.org/
- McKinsey & Company. (2023). The economic potential of generative AI: The next productivity frontier. https://www.mckinsey.com/capabilities/tech-and-ai/our-insights/the-economic-potential-of-generative-ai-the-next-productivity-frontier
- McKinsey & Company. (2025, November). The state of AI 2025: Agents, innovation, and transformation. https://www.mckinsey.com/capabilities/quantumblack/our-insights/the-state-of-ai
- OECD. (2024). Miracle or myth? Assessing the macroeconomic productivity gains from artificial intelligence. https://www.oecd.org/
- Stanford HAI. (2025). Artificial Intelligence Index Report 2025. https://hai.stanford.edu/ai-index/2025-ai-index-report
- Stanford HAI. (2026). Artificial Intelligence Index Report 2026. https://hai.stanford.edu/ai-index/2026-ai-index-report
- US Census Bureau. (2024). Tracking firm use of AI in real time: A snapshot from the Business Trends and Outlook Survey (CES-WP-24-16). https://www.census.gov/library/working-papers/2024/adrm/CES-WP-24-16.html
Workplace productivity — RCTs and field experiments
- Bick, A., Blandin, A., & Deming, D. J. (2024). The rapid adoption of generative AI (NBER Working Paper). National Bureau of Economic Research.
- Brynjolfsson, E., Li, D., & Raymond, L. R. (2023). Generative AI at work (NBER Working Paper No. 31161). National Bureau of Economic Research. https://www.nber.org/papers/w31161
- Brynjolfsson, E., Li, D., & Raymond, L. R. (2025). Generative AI at work. The Quarterly Journal of Economics, 140(2), 889–942. https://academic.oup.com/qje/article/140/2/889/7990658
- Choi, J. H., & Schwarcz, D. (2023). AI assistance in legal analysis: An empirical study (SSRN 4539836). https://papers.ssrn.com/sol3/papers.cfm?abstract_id=4539836
- Choi, J. H., Monahan, A., & Schwarcz, D. (2024). Lawyering in the age of artificial intelligence (SSRN 4626276). https://ssrn.com/abstract=4626276
- Dell'Acqua, F., McFowland, E. III, Mollick, E. R., Lifshitz-Assaf, H., Kellogg, K., Rajendran, S., Krayer, L., Candelon, F., & Lakhani, K. R. (2023). Navigating the jagged technological frontier (HBS Working Paper 24-013). https://www.hbs.edu/ris/Publication%20Files/24-013_d9b45b68-9e74-42d6-a1c6-c72fb70c7282.pdf
- Dillon, E., et al. (2025). Microsoft 365 Copilot field experiment (Harvard Business School).
- Donati, D., et al. (2025). AI and online retail productivity / sales uplift evidence (arXiv preprint).
- GitHub / Microsoft Research. (2023). The impact of AI on developer productivity: Evidence from GitHub Copilot (arXiv:2302.06590). https://arxiv.org/abs/2302.06590
- METR. (2025, July). Measuring the impact of early-2025 AI on experienced open-source developer productivity. https://metr.org/blog/2025-07-10-early-2025-ai-experienced-os-dev-study/
- MIT Generative AI Lab. (2025). Copilot field experiment with Microsoft and Accenture.
- Noy, S., & Zhang, W. (2023). Experimental evidence on the productivity effects of generative artificial intelligence. Science, 381(6654), 187–192. https://www.science.org/doi/10.1126/science.adh2586
- UK Government. (2025). Microsoft 365 Copilot experiment: Cross-government findings report. https://www.gov.uk/
AI in the workplace — surveys
- BCG. (2025, June). AI at work 2025: Momentum builds, but gaps remain. Boston Consulting Group. https://www.bcg.com/publications/2025/ai-at-work-momentum-builds-but-gaps-remain
- Microsoft. (2024, May). Work Trend Index 2024: AI at work is here. Now comes the hard part. https://www.microsoft.com/en-us/worklab/work-trend-index/ai-at-work-is-here-now-comes-the-hard-part
- Microsoft. (2025). Breaking down the infinite workday. https://www.microsoft.com/en-us/worklab/work-trend-index/breaking-down-infinite-workday
- PwC. (2025). The fearless future: 2025 Global AI Jobs Barometer. https://www.pwc.com/gx/en/services/ai/ai-jobs-barometer.html
Enterprise AI failure and ROI
- Bain & Company. (2025). Technology Report 2025: AI leaders are extending their edge. https://s3.amazonaws.com/media.mediapost.com/uploads/BAIN_report_technology_report_2025.pdf
- Bain & Company. (2025, September 23). $2 trillion in new revenue needed to fund AI's scaling trend [Press release]. https://www.bain.com/about/media-center/press-releases/20252/$2-trillion-in-new-revenue-needed-to-fund-ais-scaling-trend---bain--companys-6th-annual-global-technology-report/
- MIT NANDA Initiative. (2025, August). The GenAI Divide: State of AI in business 2025. https://mlq.ai/media/quarterly_decks/v0.1_State_of_AI_in_Business_2025_Report.pdf
- RAND Corporation. (2024). The root causes of failure for artificial intelligence projects and how they can succeed. https://www.rand.org/pubs/research_reports/RRA2680-1.html
Sector-specific evidence
- American Medical Association. (2025). AI scribes save 15,000 hours and restore the human side of medicine. https://www.ama-assn.org/practice-management/digital-health/ai-scribes-save-15000-hours-and-restore-human-side-medicine
- Mass General Brigham. (2026). AI scribes linked to modest reductions in electronic health record use and clinical documentation time.
- McKinsey & Company. (2024). Generative AI fuels creative physical product design but is no magic wand.
- McKinsey & Company. (2025). Generative AI in healthcare. https://www.mckinsey.com/industries/healthcare/our-insights/generative-ai-in-healthcare-current-trends-and-future-outlook
- McKinsey & Company. (2025). Manufacturing lighthouses — Capturing the full value of AI. https://www.mckinsey.com/capabilities/operations/our-insights/how-manufacturings-lighthouses-are-capturing-the-full-value-of-ai
- Thomson Reuters. (2024). AI set to save professionals 12 hours per week by 2029.
- UCLA Health. (2025). UCLA study finds AI scribes may reduce documentation time and improve physician well-being. https://www.uclahealth.org/news/release/ucla-study-finds-ai-scribes-may-reduce-documentation-time
AI maximalist claims
- Amodei, D. (2024, October). Machines of loving grace. https://www.darioamodei.com/essay/machines-of-loving-grace
- Amodei, D. (2025, May 28). Interview in Axios. AI jobs danger: Sleepwalking into a white-collar bloodbath. https://www.axios.com/2025/05/28/ai-jobs-white-collar-unemployment-anthropic
- Anthropic. (2026, January). Anthropic Economic Index report: Economic primitives. https://www.anthropic.com/research/anthropic-economic-index-january-2026-report
- Anthropic. (2026, March). Anthropic Economic Index report: Learning curves. https://www.anthropic.com/research/economic-index-march-2026-report
- Anthropic. (2026). Labor market impacts of AI: A new measure and early evidence. https://www.anthropic.com/research/labor-market-impacts
- Huang, J. (2024, March 19). Comments at GTC Conference. AGI and hallucinations. TechCrunch. https://techcrunch.com/2024/03/19/agi-and-hallucinations/
- Huang, J. (2025, May 28). Comments at Milken Institute Global Conference. CNBC. https://www.cnbc.com/2025/05/28/nvidia-ceo-jensen-huang-youll-lose-your-job-to-somebody-who-uses-ai.html
- Solow, R. M. (1987, July 12). We'd better watch out. New York Times Book Review.
Pricing science
- Anderson, J. C., Narus, J. A., & Van Rossum, W. (2006). Customer value propositions in business markets. Harvard Business Review, 84(3), 91–99. https://hbr.org/2006/03/customer-value-propositions-in-business-markets
- Bessemer Venture Partners. (2025). The AI pricing and monetization playbook. https://www.bvp.com/atlas/the-ai-pricing-and-monetization-playbook
- Hinterhuber, A. (2004). Towards value-based pricing — An integrative framework for decision making. Industrial Marketing Management, 33(8), 765–778. https://users.metu.edu.tr/mugan/Hinterhuber%202004%20value%20based%20pricing.pdf
- Hinterhuber, A., & Snelgrove, T. C. (2022). Value first, then price: Building value-based pricing strategies (2nd ed.). Routledge.
- Stobierski, T. (2022). A beginner's guide to value-based strategy. Harvard Business School Online. https://online.hbs.edu/blog/post/what-is-value-based-strategy
Statista evidence (13 charts integrated)
- Statista. (2024). Revenue impact of AI in financial services (Chart 1254724). https://www.statista.com/statistics/1254724/revenue-impact-of-ai-financial-services/
- Statista. (2024). Working hours impacted by generative AI in finance, by sector — Accenture data (Chart 1558899). https://www.statista.com/statistics/1558899/working-hours-impacted-generative-ai-finance/
- Statista. (2024). AI fintech impact on profitability (Chart 1617474). https://www.statista.com/statistics/1617474/ai-fintech-impact-on-profitability/
- Statista. (2025). Growth of labor productivity — AI adoption (Chart 1378626). https://www.statista.com/statistics/1378626/growth-of-labor-productivity-ai-adoption-2023/
- Statista. (2025). AI impact on hourly rates-based pricing global (Chart 1482387). https://www.statista.com/statistics/1482387/ai-impact-on-hourly-rates-based-pricing-global/
- Statista. (2025). Functional impact of generative AI worldwide (Chart 1610445). https://www.statista.com/statistics/1610445/functional-impact-of-generative-ai-worldwide/
- Statista. (2025). Cost decrease by AI function (Chart 1610952). https://www.statista.com/statistics/1610952/cost-decrease-by-ai-analytics-enterprise/
- Statista. (2025). Adoption of pricing models for agentic AI tools (Chart 1620734). https://www.statista.com/statistics/1620734/adoption-of-pricing-models-for-agentic-ai-tools/
- Statista. (2025). AI task automation trends among employees globally — Capgemini, June 2025 (Chart 1619156). https://www.statista.com/statistics/1619156/ai-task-automation-trends-among-employees-global/
- Statista. (2026). AI impact on profitability in finance worldwide (Chart 1661254). https://www.statista.com/statistics/1661254/ai-impact-on-profitability-in-finance-worldwide/
- Statista. (2026). AI impact on profitability in financial services by characteristics (Chart 1661255). https://www.statista.com/statistics/1661255/ai-impact-on-profitability-in-finance-worldwide-by-characteristics/
- Statista. (2026). AI impact on workforce in last 3 years — finance worldwide (Chart 1661260). https://www.statista.com/statistics/1661260/ai-impact-on-workforce-in-last-three-years-finance-worldwide/
- Statista. (2026). Big Tech AI spending to reach $725 billion in 2026 (Chart 35046). https://www.statista.com/chart/35046/capital-expenditure-of-meta-alphabet-amazon-and-microsoft/
Valueships proprietary frameworks (citable as such)
- Wilczyński, M. (2026, May). The Valueships Historical Productivity Ladder. Valueships proprietary framework.
- Wilczyński, M. (2026, May). The Valueships Value Equation and the AI Value Index (AVI). Valueships proprietary framework.
- Wilczyński, M. (2026, May). The AVI Pricing Quadrant™. Valueships proprietary framework.
Finance lineage (AVI)
- Stern, J. M., Stewart, G. B., & Chew, D. H. (1995). The EVA financial management system. Journal of Applied Corporate Finance, 8(2), 32–46. https://doi.org/10.1111/j.1745-6622.1995.tb00295.x